A department name is not a process map. “Sales” does not show who confirms an order, and “HR” does not tell you whether a new employee can work on the first day. Useful business process examples connect a specific trigger to a result that someone can verify. A business process is a connected set of activities that turns an input or request into a defined business outcome. Examples include fulfilling a customer order, purchasing goods, onboarding an employee, resolving a service request, correcting a quality issue, and publishing approved content. To automate one, define its trigger, owner, decisions, data, exceptions, and completion evidence before selecting the tools that will move the work forward.
Key takeaways
A useful process example names the trigger and the result, not just the department or software involved.
Automation opportunities occur at specific steps: collecting data, routing work, applying rules, and confirming system actions.
Every example needs an exception owner and a clear way to resume, reject, or cancel work.
Measure the business outcome and its quality; a fast notification is not proof that the whole process improved.
Use the six maps below as starting designs, then validate them against your organization’s actual work.
Business process examples at a glance
Business processes cross organizational boundaries. A purchase may involve the requester, procurement, receiving, accounts payable, and a supplier. A single team can own the overall outcome while several teams perform the work. The table below preserves the industry view of process examples and makes the outcomes more explicit. These are illustrative examples, not a mandatory taxonomy. For a broader process inventory and common terminology, consult APQC’s Process Classification Framework.
Common business processes and their intended outcomes
Business area
Process examples
A result to verify
Manufacturing
Order fulfillment, engineering change, quality issue resolution, maintenance.
The accepted product, approved change, or completed service is recorded.
Finance
Invoice handling, expense approval, capital expenditure approval.
A valid transaction or decision is recorded in the appropriate system.
Healthcare administration
Appointment scheduling, referral administration, equipment service requests.
The administrative request has a confirmed disposition and an accountable owner.
Banking operations
Customer onboarding, service inquiries, document collection.
The request reaches its authorized endpoint with the required evidence.
Travel
Trip approval, booking, itinerary changes, expense handling.
The traveler has a confirmed arrangement or a documented alternative.
Procurement
Purchase requisition, supplier selection, receipt and invoice matching.
The approved need is fulfilled and the supplier transaction is resolved.
Sales and marketing
Customer inquiry, quote approval, order handoff, content publication.
The customer commitment or approved communication is delivered.
HR and employee services
Hiring, onboarding, equipment requests, internal help desk.
The person receives the agreed decision, access, equipment, or support.
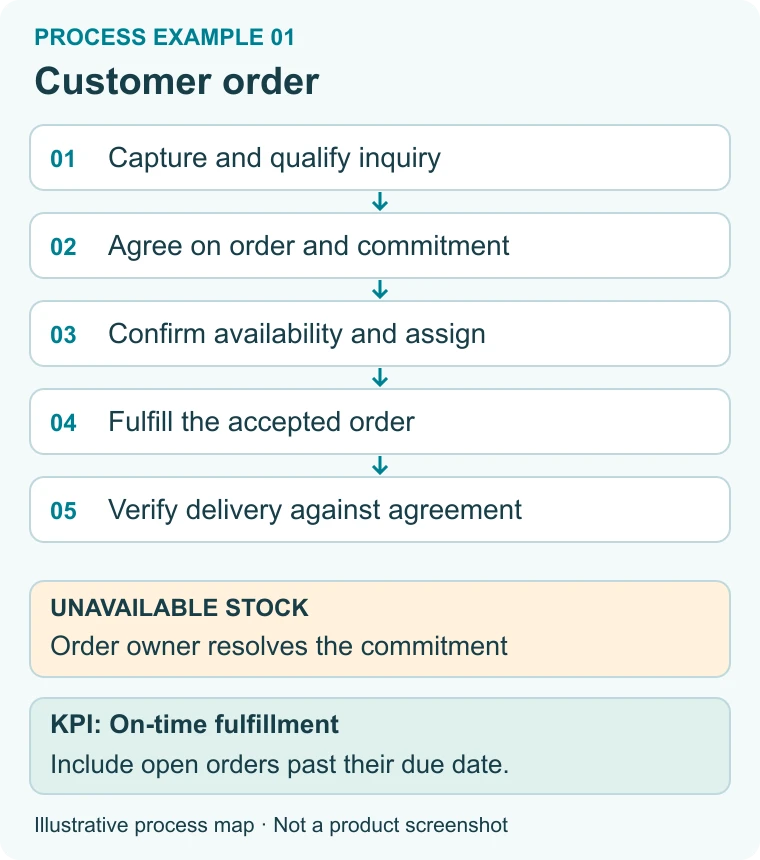
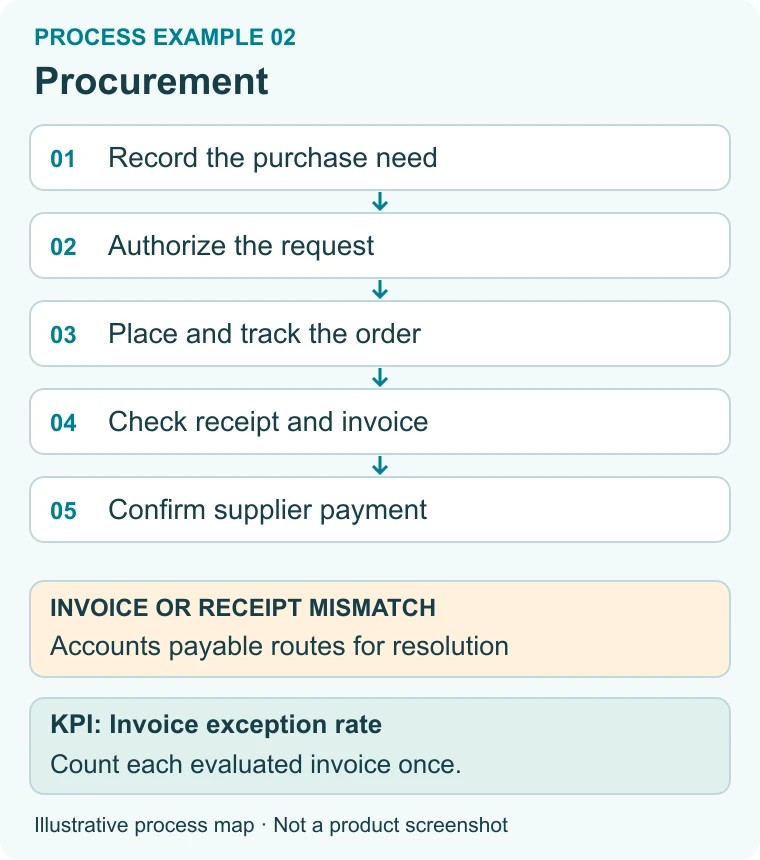
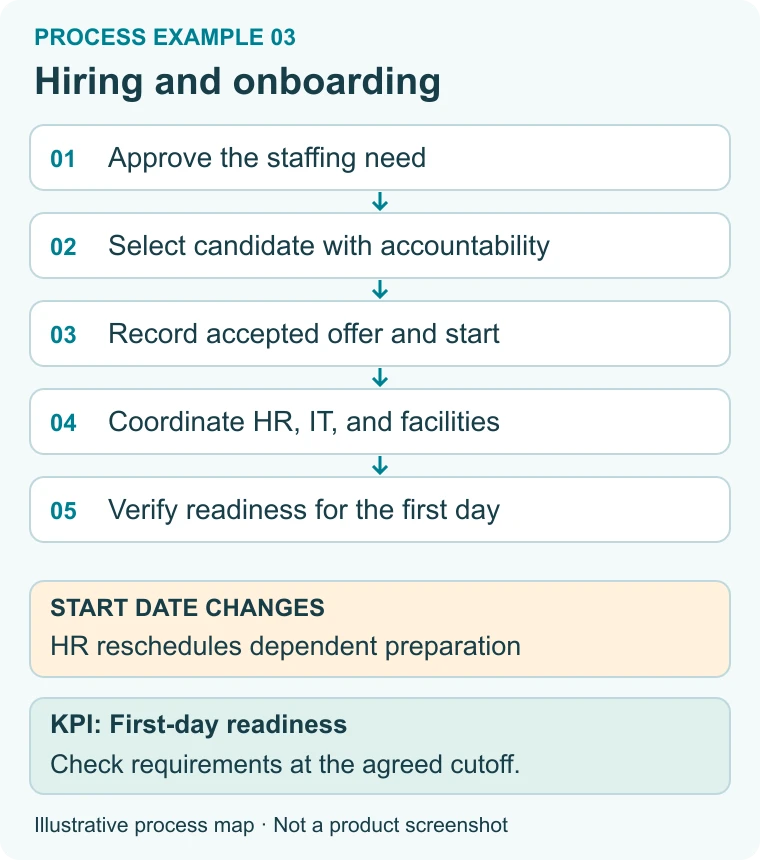
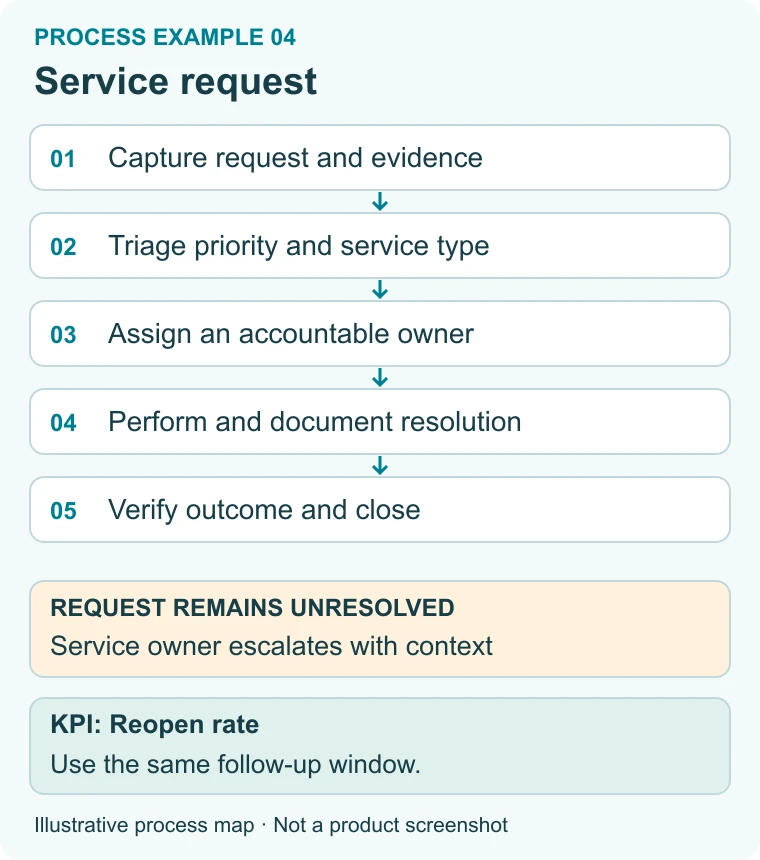
How to read the six maps: each is an original, simplified design for a common process. It shows the normal sequence and calls out an exception and a measurement. The surrounding text supplies roles, data, and decisions. These are teaching examples, not customer-specific configurations or complete regulatory procedures.
1. Customer-facing process: inquiry to fulfilled order
Trigger: a customer submits an inquiry that can become an order. Outcome: the agreed goods or services are delivered and completion is recorded, or the inquiry is closed with a clear reason.Customer order map. Confirm delivery against the agreed order; an unavailable item needs a decision before the commitment changes.Roles and data: sales owns the inquiry and commercial agreement; operations owns fulfillment; the process owner resolves handoff problems. Connect the customer, inquiry, quote version, order, promised date, and fulfillment record using stable identifiers. Customer relationship management (CRM) software may hold the inquiry, while an enterprise resource planning (ERP) system manages the order and inventory. Automation opportunities: assign inquiries by a defined territory or product rule, validate required fields, request approval for an exception to standard terms, and create fulfillment tasks after the customer accepts the agreement. Reuse the approved data instead of asking operations to retype an emailed quote. Exception to design: stock becomes unavailable after the quote was prepared. Route the issue to an owner who can agree on a substitute, revised date, or cancellation with the customer. A system-generated order acknowledgment must not silently establish a delivery promise the business cannot meet. KPI: on-time fulfillment rate = orders fulfilled by their agreed due time ÷ all orders whose agreed due time has passed in the defined cohort × 100. Keep open overdue orders in the denominator. If a customer agrees to a new date, retain the original promise and report changes separately so the measure cannot improve merely by moving deadlines.
2. Procurement process: purchase need to supplier payment
Trigger: an employee submits a purchase need. Outcome: the authorized purchase is received and the supplier payment is confirmed, or the request is rejected, canceled, or otherwise resolved through a defined path.Procurement map. Approval, receipt, invoice validation, and payment are distinct checkpoints.Roles and data: the requester explains the need; a budget owner authorizes it; procurement manages the supplier and order; receiving confirms delivery; accounts payable handles the invoice and payment status. Link the requisition, purchase order, receipt, invoice, and payment reference without treating them as the same record. Automation opportunities: check completeness at intake, route requests using approved spending rules, notify receiving when an order is placed, and compare invoice data with the relevant order and receipt. The procurement management solution is the appropriate place to explore software support for this sequence. Exception to design: the supplier sends an invoice for the full order after only part of the goods arrives. Record the discrepancy and assign its resolution. Do not use “invoice received” as evidence that the whole purchase is ready for payment. Partial receipts, credit notes, and canceled lines need explicit handling under the organization’s purchasing rules. KPI: invoice exception rate = invoices routed for discrepancy resolution ÷ invoices first evaluated in the same period × 100. Count each invoice once in the denominator, even if it goes through several correction loops. Track unresolved exceptions by age so a lower rate cannot hide an old backlog.
3. Employee lifecycle process: hiring and onboarding
Trigger: an approved staffing need starts recruiting. Outcome: a selected candidate accepts the role and completes the organization’s onboarding requirements, or the hiring request reaches a documented closed state.Employee lifecycle map. After offer acceptance, HR, IT, facilities, and the manager coordinate preparation for the agreed start.Roles and data: the hiring manager defines the role; HR coordinates recruiting and the offer; authorized decision-makers select the candidate; IT and facilities prepare the agreed resources. The onboarding record connects the accepted role, manager, location, start date, equipment, and approved access requirements. Automation opportunities: coordinate interview scheduling, collect required information, generate assigned checklists after offer acceptance, and remind owners about incomplete preparation. Candidate selection remains a defined accountable decision. Keyword matching in a resume should not be presented as proof that a candidate is the best fit. Exception to design: the start date changes after accounts or equipment have been requested. Update the dependent tasks and notify their owners. If the hire is canceled, confirm the disposition of prepared access and equipment. A completed HR form alone does not demonstrate that a person is ready to work. KPI: first-day readiness rate = new starters with all defined day-one prerequisites confirmed by the cutoff ÷ all starters expected at that cutoff × 100. Define prerequisites before measuring. Separate delayed start dates from missing preparations instead of quietly removing difficult cases. For more detail, see the existing new-hire management guide.
4. Service operations process: request to resolution
Trigger: an employee or customer requests help. Outcome: the service is restored or the requested assistance is delivered and verified, with a recorded reason for any alternative closure.Service request map. A response to the requester and a verified resolution are different events.Roles and data: the service desk captures the affected service, symptoms, impact, requester, and relevant evidence. A resolver owns diagnosis or fulfillment; a service owner handles unresolved dependencies. Preserve a link between the original request, related incidents, and any follow-up work. Automation opportunities: categorize straightforward requests, check required information, route work to the appropriate team, show the requester its status, and prompt for confirmation after a proposed resolution. Route uncertain classifications to a person instead of repeatedly moving the request between queues. Exception to design: the resolver marks an issue fixed, but the requester reports that it persists. Define whether the record reopens or a linked follow-up is created, who owns it, and which clock continues. Otherwise, closing and recreating tickets can make performance look better while the person still lacks service. KPI: reopen rate = requests reopened within a defined follow-up window ÷ closed requests with that full observation window available × 100. State the window, such as seven calendar days for an illustrative internal report. Do not compare yesterday’s closures with older closures that had more time to reopen.
5. Product and quality process: issue to verified corrective action
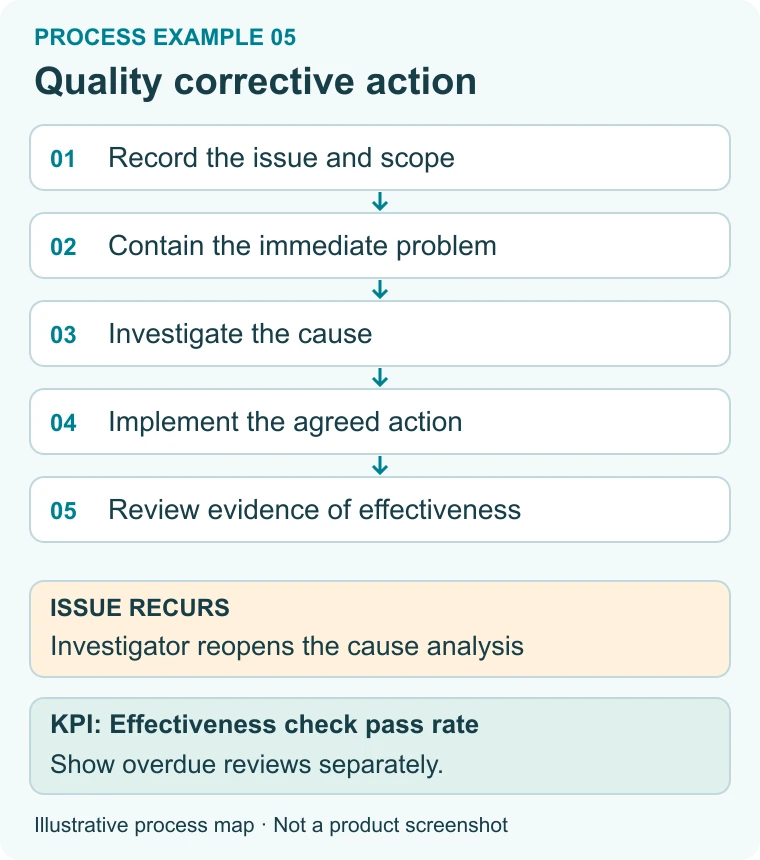
Trigger: a defect, recurring failure, or internal finding requires investigation. Outcome: an authorized owner verifies that the agreed action addressed the identified cause, or documents the reason for further work.Quality action map. Completing an action and checking its effectiveness require separate evidence.Roles and data: the reporter supplies the observation; an operational owner contains the immediate issue; a qualified investigator examines causes; the action owner implements the agreed change; a designated reviewer evaluates its effect. Connect the issue, affected items, investigation, actions, evidence, and review date. Automation opportunities: create action assignments, track due dates, request supporting evidence, and schedule the effectiveness review. A workflow can make missing evidence visible. It cannot establish that the investigation reached the right conclusion merely because every task has a completed status. Exception to design: the issue recurs during the agreed observation period. Return it to investigation with the earlier evidence intact. Record why the previous action was insufficient and whether immediate containment is needed again. This is a general operational example; industry-specific quality procedures require their own qualified review. KPI: effectiveness pass rate = actions passing their first scheduled effectiveness review ÷ actions whose first effectiveness review was completed in the defined cohort × 100. Show overdue reviews alongside that rate. A high pass rate from a small, selectively completed subset does not describe the whole action program.
6. Marketing process: content request to verified publication
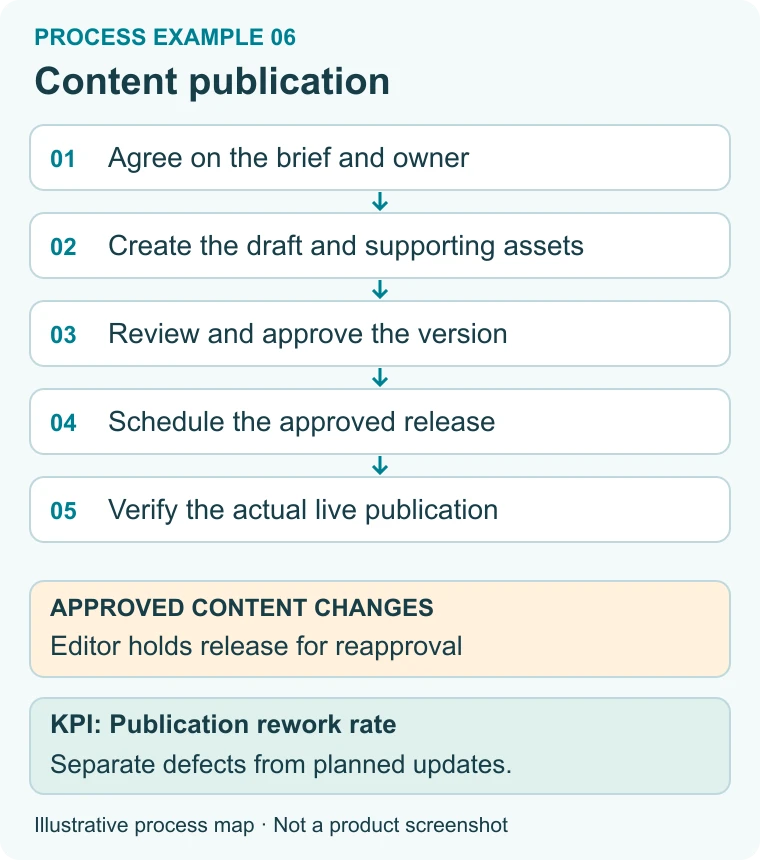
Trigger: an approved request for a campaign asset, article, or social post enters the content queue. Outcome: the approved version is published in the intended channel and checked, or the request is canceled with a reason.Content publication map. The approved version, scheduled version, and live version should remain traceable.Roles and data: a requester supplies the purpose and audience; a content owner manages production; designated reviewers check the relevant claims and requirements; a publisher controls the channel and release time. Track the brief, asset version, approvals, destination, planned release, and actual public location. Automation opportunities: assign work, collect review feedback in one place, remind reviewers of deadlines, and schedule an approved asset. The useful automation is the controlled handoff between stages, not an arbitrary rule to publish more frequently. Exception to design: a fact or approved offer changes after scheduling. Hold the release and return the affected version for review. A successful scheduling action does not prove that the final page or post appeared correctly; verify the public result and record failures such as a broken link or missing image. KPI: publication rework rate = released assets requiring a defined avoidable correction within the observation window ÷ released assets with that full window available × 100. Agree on what counts as a correction, and distinguish a planned content update from an avoidable publication defect.
How to model each example before automating it
Model the work at a level that allows another person to understand who does what and what evidence moves it forward. The maps in this guide summarize the sequence. A working design needs more detail before implementation.
Observe a real instance. Follow an order, request, or issue through the current process. Record the actual handoffs, including email, spreadsheets, and work outside the main application.
Define the boundary. Name the trigger and accepted completion evidence. Separate intermediate approvals from the outcome the requester needs.
Assign responsibility. Name the process owner, each task owner, and the person who resolves an exception.
Connect the data. Define identifiers, required fields, document versions, systems of record, and access appropriate to each role.
Design alternate paths. Test missing information, rejection, cancellation, duplicates, unavailable participants, and failed system actions.
Pilot and measure. Run a limited cohort, review actual outcomes, and revise the design before expanding it.
Business Process Model and Notation (BPMN) 2.0.2 is the Object Management Group’s specification for a shared process notation. Use its events, activities, and routing elements when a formal diagram helps stakeholders agree on behavior. These simplified maps are not executable BPMN models. The BPMN elements guide provides a separate introduction to the notation. Choose automation step by step. Forms can standardize intake; a workflow engine can assign work and apply routing rules; an application programming interface (API) can exchange data with another system. Robotic process automation (RPA) can automate repetitive interactions with applications. These tools perform different jobs, so a diagramming tool and an execution tool should not be treated as interchangeable. If AI is used to classify requests or extract document fields, define how uncertainty is handled and which output needs verification before it drives an action. The NIST AI Risk Management Framework provides a voluntary framework for managing AI risks. It does not certify a particular automation or eliminate the need to test it in context.
Measure the value of a process change
Separate business outcomes, elapsed time, hands-on effort, and cash costs. Automation may reduce manual handling without shortening a delay caused by an unavailable decision-maker. It may release staff capacity without reducing payroll expenditure.
Record the same boundaries before and after a change
Measure
What to record
Common mistake
Business result
The accepted outcome, due date, and any open overdue work.
Counting a completed software task as a completed customer commitment.
Elapsed time
Start and finish timestamps, time zone, calendar, and paused-clock rules.
Comparing an old submission-to-finish clock with a new approval-to-finish clock.
Hands-on effort
Observed handling time for the same activities and comparable request types.
Adding overlapping durations or treating all waiting time as staff effort.
Quality
Returns, reopens, errors, or failed checks with a defined observation window.
Claiming improvement while ignoring the cost of correction.
Cost
Setup, operation, support, training, and realized changes in expenditure.
Reporting theoretical capacity value as cash savings or ROI.
Illustrative before-and-after calculation: assume 300 comparable requests per month. Assume a pilot would reduce the selected handling time from 12 to 8 minutes per request. Estimated released capacity is 300 × (12 − 8) ÷ 60 = 20 staff hours per month. At an assumed loaded labor rate of $40 per hour, that capacity has an estimated value of $800 per month before software, implementation, training, support, and correction costs. Every input here is a teaching assumption, not a customer result or a price quote. The calculation estimates effort capacity; it does not demonstrate cash savings or a positive return on investment. Validate the handling times with comparable real requests, keep the original measurements, and check the quality metrics before claiming a benefit. For example, saving four minutes at intake is not an improvement if downstream teams spend longer correcting incomplete information.
CMW Lab customer evidence: coordinating work at 16 kHz
The published 16 kHz case study describes a record-pressing company working with vendor partners whose ordering and tracking processes differed. Manual work created paperwork and reduced visibility. The company needed to coordinate tasks across people working outside the office. The documented change was to use CMW Tracker for sequences of automatically generated tasks, assigning the next task after a preceding workflow step was complete. The case describes improved visibility and clearer task responsibility; it does not provide a measured before-and-after time or cost dataset.
“deploy tasks to individuals based on our product life cycle”
Mark Calabro, identified as the owner of 16 kHz in CMW Lab’s published case study, describing the need that led to the implementation. This is an excerpt from the existing case, not a new interview. The transferable lesson is the handoff: connect the completion of one step to a known next owner, while keeping the overall process visible. The six maps in this article are editorial examples and are not representations of 16 kHz’s internal workflows. CMW Lab’s current business process automation platform page describes visual process design, form building, data management, and integration capabilities. Bring one of your actual requests, its supporting records, and an exception to a demonstration so you can evaluate how the proposed configuration handles them. Practical next step: choose the example closest to a recurring bottleneck, write down its completion evidence, and map one real instance with the people who perform the work. Use that map to discuss the process with CMW Lab and define a pilot that can be measured.
Frequently asked questions
What is a simple example of a business process?
An equipment request is a simple business process: an employee submits a need, an authorized person approves it, a team provides the equipment, and receipt is confirmed. The request, decision, fulfillment, and confirmation connect to a defined outcome. Each step needs an owner, and rejected or incomplete requests need a clear alternate path.
How is a business process different from a workflow?
A business process describes how an organization achieves an outcome; a workflow describes how tasks and information move through part or all of that work. The terms can overlap in practice. When documenting an example, make the boundary explicit so completing one workflow, such as an approval, is not confused with completing the entire business result.
Which business process should a company automate first?
Start with a recurring process that has a clear owner, observable delays or errors, and a defined completion condition. Confirm that its rules and data are sufficiently understood to support a controlled pilot. A small process with measurable outcomes is easier to evaluate than a large program whose responsibilities and exception paths remain unresolved.
What KPIs should business process examples include?
Include at least one outcome measure and one quality measure relevant to the process. Examples include on-time fulfillment paired with rework, or service resolution paired with reopening. Define the cohort, denominator, time window, and treatment of open work. Add handling effort or cost measures only when the underlying data can be collected consistently.
What are common process automation mistakes?
Common design mistakes include automating an unclear process, leaving exceptions without an owner, using inconsistent data, and measuring only completed work. Another is assuming that sending a request to a system proves the intended action occurred. Test the failure paths and verify the business outcome before expanding an automation to more teams or higher volumes. Source and method note: the maps, KPI definitions, and numerical illustration are original editorial teaching materials. The customer case and technical references are linked where used. Product statements describe publicly documented capabilities, not a promise that every example is available as a preconfigured application.