
By Pavel · CMW Lab blog author · Last reviewed: September 16, 2026
Workflow process mapping makes the path from a request to a result visible, including the people, decisions, systems, and exceptions involved. It matters because teams can test whether they understand the same process before changing or automating it. A useful map documents how work happens today, identifies evidence of delays or rework, and provides a shared basis for designing and validating a better workflow.
A purchase request can look simple in a procedure: submit, approve, order. Ask the requester, approver, and buyer to describe the last incomplete request, however, and three different processes may emerge. One person sees an unanswered email; another sees a request waiting for a cost center; the third has never received it. Business process mapping makes those differences discussable.
The value comes from what the team learns and changes, not from the number of boxes it draws. This guide explains how to scope a map, document the current workflow, validate exceptions, and turn the result into an improvement plan.
Key takeaways
- Map the current process before designing its replacement; keep the two versions visibly separate.
- Show ownership, decision criteria, and handoffs alongside the main sequence of activities.
- Choose the detail needed for the decision: a scope discussion and an executable workflow need different maps.
- Validate the map with actual cases, including incomplete, rejected, delayed, and canceled work.
- Measure changes with consistent boundaries and definitions; a cleaner diagram does not prove a faster process.
What is business process mapping?
Business process mapping is the practice of documenting how work moves from a defined trigger to a defined outcome. A process map is the resulting representation. It can show activities, participants, inputs and outputs, decisions, and the movement of information or materials. Workflow mapping focuses attention on how individual pieces of work move through that process.
An as-is map describes current practice, including workarounds. A to-be map describes an intended future process. Neither label establishes that the process is correct: the current map needs evidence, while the future map needs testing. If a team silently replaces an awkward current step with an ideal one, it loses the baseline needed to explain the proposed change.
A useful map answers four practical questions: What starts the work? Who is responsible next? What determines the route? What proves that the work is finished? Supporting notes should identify the data and systems involved. A box labeled “Handle request” answers none of these questions; “Buyer checks supplier and cost center” is a more actionable activity.
Key benefits of workflow process mapping
Workflow process mapping as a learning tool
Mapping exposes the difference between a written procedure and the way people complete work. Ask participants to walk through a recent case while showing the records they used. The exercise can reveal an approval performed in a chat, an unofficial spreadsheet, or an exception that only one experienced employee knows how to resolve.
That knowledge helps with onboarding and continuity, but the map needs an owner and a review date. A new employee should be able to identify the next responsible role and the correct escalation route. If doing so still requires finding the person who originally drew the diagram, the handoff information is incomplete.
Workflow mapping can lead to optimizing efficiency
A map makes delays and rework easier to investigate. Separate time spent doing a task from time spent waiting for it. An approval may take five minutes of effort while a request waits two days in a queue. Removing a data-entry step will not necessarily resolve that queue.
Treat apparent bottlenecks as hypotheses until case data supports them. Annotate the step with the observed delay, the evidence period, and the affected request type. This connects the proposed improvement to a specific problem instead of assuming that fewer boxes always mean better performance.
Improved communication between employees engaged in a process
Handoffs often need more explanation than activities. Specify what the sender provides, what the receiver accepts, and what happens when the information is incomplete. For example, procurement can require a cost center and a delivery location before accepting a request, while the requester remains responsible for correcting missing information.
A swimlane process map places activities in lanes for their responsible roles or teams. Crossing a lane boundary makes a handoff visible. It does not, by itself, define access permissions, authority to approve, or accountability for the whole process; document those separately.
Process map, flowchart, BPMN, or value stream map?
These terms describe related tools with different purposes. A flowchart can be a process map; Business Process Model and Notation (BPMN) adds standardized modeling semantics. A value stream map emphasizes the flow of materials and information, including the relationship between work and waiting. Choose a technique according to the question you need to answer.
| Technique | Best question to start with | What to add before implementation |
|---|---|---|
| SIPOC | Where does the process begin and end, and who supplies and receives its outputs? | Detailed sequence, owners, decisions, and exceptions. |
| Basic flowchart | What happens next, and where does the route change? | Responsibility, data requirements, timing, and consistent symbol definitions. |
| Swimlane map | Who performs each activity, and where does work cross team boundaries? | Handoff criteria, escalation, and decision authority. |
| BPMN model | How should events, branching, and coordination behave? | For execution: supported model elements, data, forms, assignments, integrations, and tests. |
| Value stream map | How do material and information flows affect delivery and elapsed time? | Reliable timing observations and a plan for the desired future flow. |
SIPOC stands for suppliers, inputs, process, outputs, and customers. ASQ’s SIPOC guidance uses it to establish a high-level view and process boundaries before deeper mapping. The Lean Enterprise Institute’s description of value stream mapping explains its focus on material and information flow. The comparison above is a practical selection guide, not a ranking or a claim that one notation replaces the others.
For BPMN, use the formal name Business Process Model and Notation. The OMG BPMN 2.0.2 specification defines the notation. For a visual introduction to its symbols, see our BPMN elements and symbols guide. A standards-based diagram still needs implementation details before a workflow engine can execute it correctly.
Start with a process scope canvas
Use this canvas before opening a diagram editor. The completed example is illustrative: it describes a proposed mapping exercise for purchase requests, not a CMW Lab customer implementation. Replace each answer with evidence from your own process.
| Field | Example answer | Question to resolve |
|---|---|---|
| Purpose | Understand why approved requests reach purchasing with missing information. | Which operational decision will this map support? |
| Start | An employee submits a purchase request. | Does the clock start at first submission or only when it is complete? |
| Finish | A purchase order is issued, or the request is rejected or canceled with a recorded reason. | Which terminal outcomes count as completion? |
| Roles | Requester, budget approver, buyer; procurement manager owns the process. | Who resolves an unassigned or disputed request? |
| Inputs and outputs | Item, quantity, cost center, location, need-by date; purchase order or closure record. | Which fields and documents are required at each handoff? |
| Systems and evidence | Request records, approval messages, purchasing system timestamps. | Can the records be joined using a stable request identifier? |
| Boundaries | Order issuance is included; receipt, invoice matching, and payment are outside this map. | Where does the next process take ownership? |
| Measures | Elapsed time, returns for missing data, approval-queue age. | Are definitions consistent across the baseline and pilot? |
The start and finish definitions deserve particular attention. If the baseline includes incomplete submissions but the future-state report starts only after validation, an apparent improvement may simply reflect a later start to the clock.
How to map and validate the current process
- Collect actual cases. Include ordinary completions and relevant variations such as returns, rejection, cancellation, and overdue work. Explain the selection period and avoid presenting a convenient sample as representative of every case.
- Trace the sequence. Record what each role did, which information was available, and which system or communication channel carried the handoff. Mark uncertain steps for follow-up.
- Label decisions with criteria. Replace “OK?” with a question such as “Required request data complete?” Name the yes and no routes and show where each route ends or rejoins.
- Separate current behavior from proposed fixes. Capture an undocumented workaround in the as-is map even if everyone agrees it should disappear. Put the change in a separate backlog.
- Walk the map with the people doing the work. Use a specific case to check the route, then test an exception. Ask the receiving team whether the handoff shown actually gives it enough information to proceed.
- Record ownership and unresolved gaps. Version the map, identify its accountable owner, and document open questions. Revisit it when the policy, system, or operating practice changes.
Validation is more than obtaining agreement in a workshop. Someone may remember a rule correctly while a system applies it differently. Compare the map with available records and investigate the difference. Where evidence is missing, label the uncertainty instead of converting a recollection into an established fact.
Keep detailed instructions close to the activity they explain without putting every field and click in the main diagram. A readable map can link to a task specification, a business-rule table, and an exception register. Our workflow diagram guide covers the visual organization of the sequence.
Worked example: an as-is and to-be purchase-request map
Illustrative baseline: an employee emails a request to a manager. The manager approves the spending and forwards it to a buyer. The buyer discovers missing delivery details, returns it to the employee, and waits for the corrected version. Several email threads now describe the same request, and the buyer must identify the approved version before issuing the order.

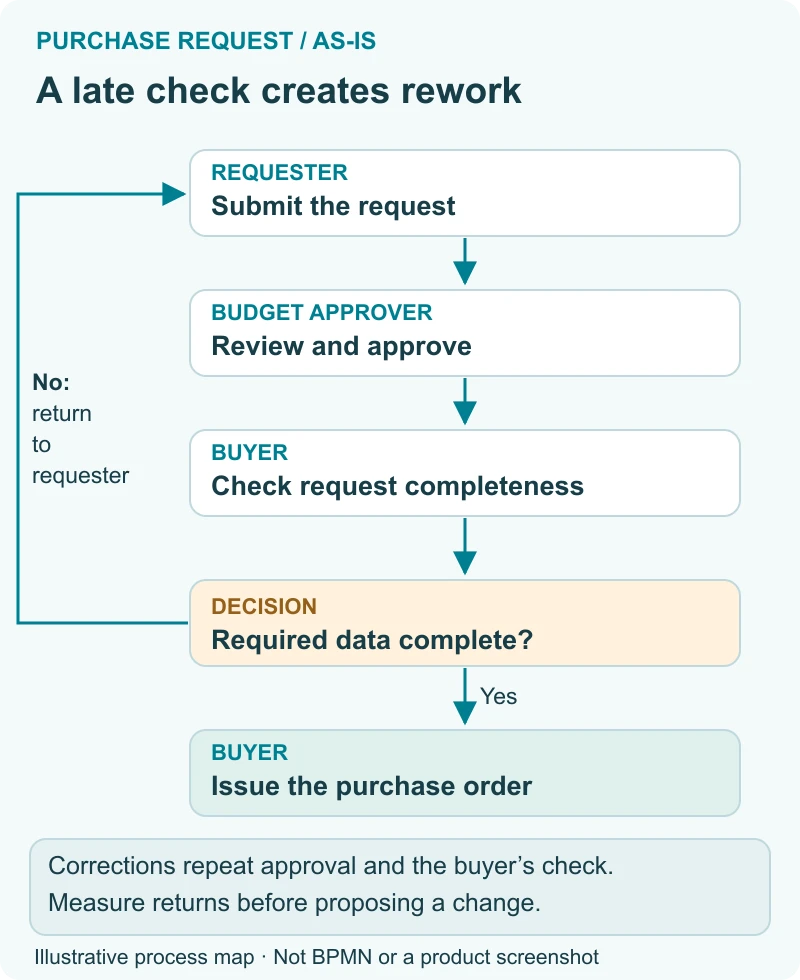
In this as-is sequence, the requester submits, the manager approves, and the buyer checks completeness. Complete requests proceed to order issuance. Incomplete requests return to the requester, then go through approval and the buyer’s check again. The map makes the repeated review visible; case records are still needed to determine its frequency and impact.
Proposed change: collect the required information in a single request record and check completeness before budget approval. Return incomplete requests to the requester with a reason. After approval, the buyer checks the approved details and issues the order. A material change to quantity, cost, or scope returns for approval under a defined rule.
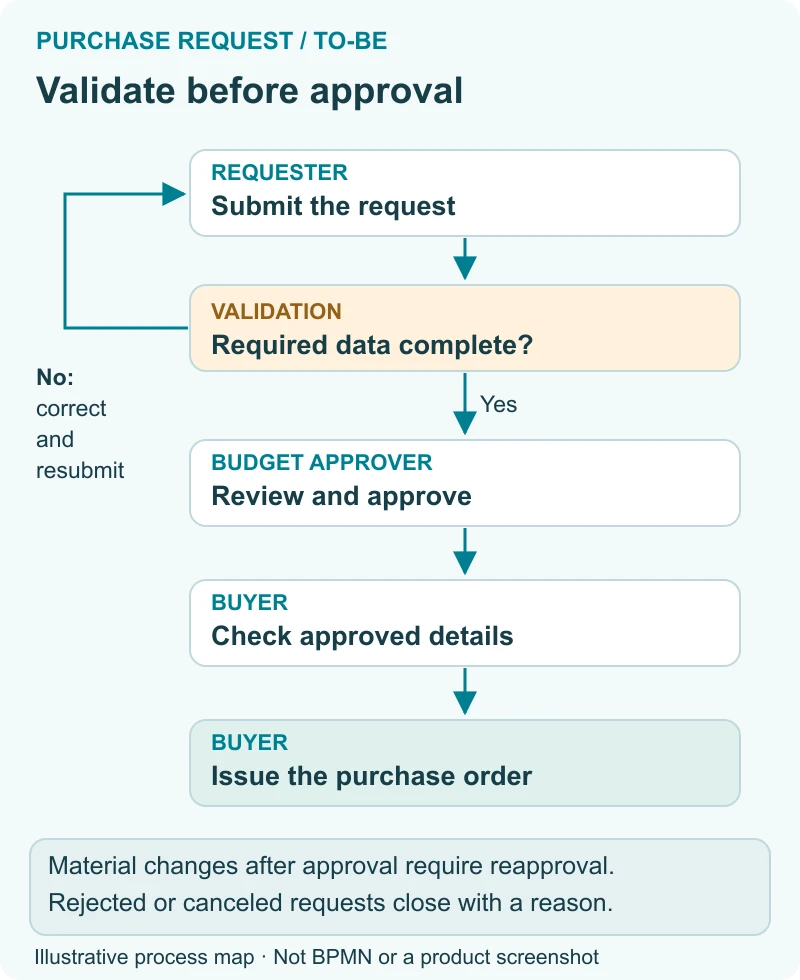
The future sequence is submit, validate completeness, approve, check approved details, and issue the order. Missing information loops back before approval. Rejected or canceled requests close with a reason. Material changes after approval take a separate reapproval route. These rules are part of the design even when the compact diagram summarizes them in a note.
The pilot must test more than the happy path. Try a missing cost center, an unavailable approver, a request changed after approval, and a cancellation after the buyer starts work. Define who owns each case and which actions remain allowed. Then compare the pilot with the baseline using the same request types and timing boundaries.
What a published CMW Lab process diagram reveals
A real public example on CMW Lab’s BPMN page includes a prepayment decision, an invoice-processing branch, a hard-copy decision, and a delivery check with a 24-hour wait. You can inspect the published process diagram to see those elements. It illustrates a model; it does not provide customer performance results or a complete operating policy.
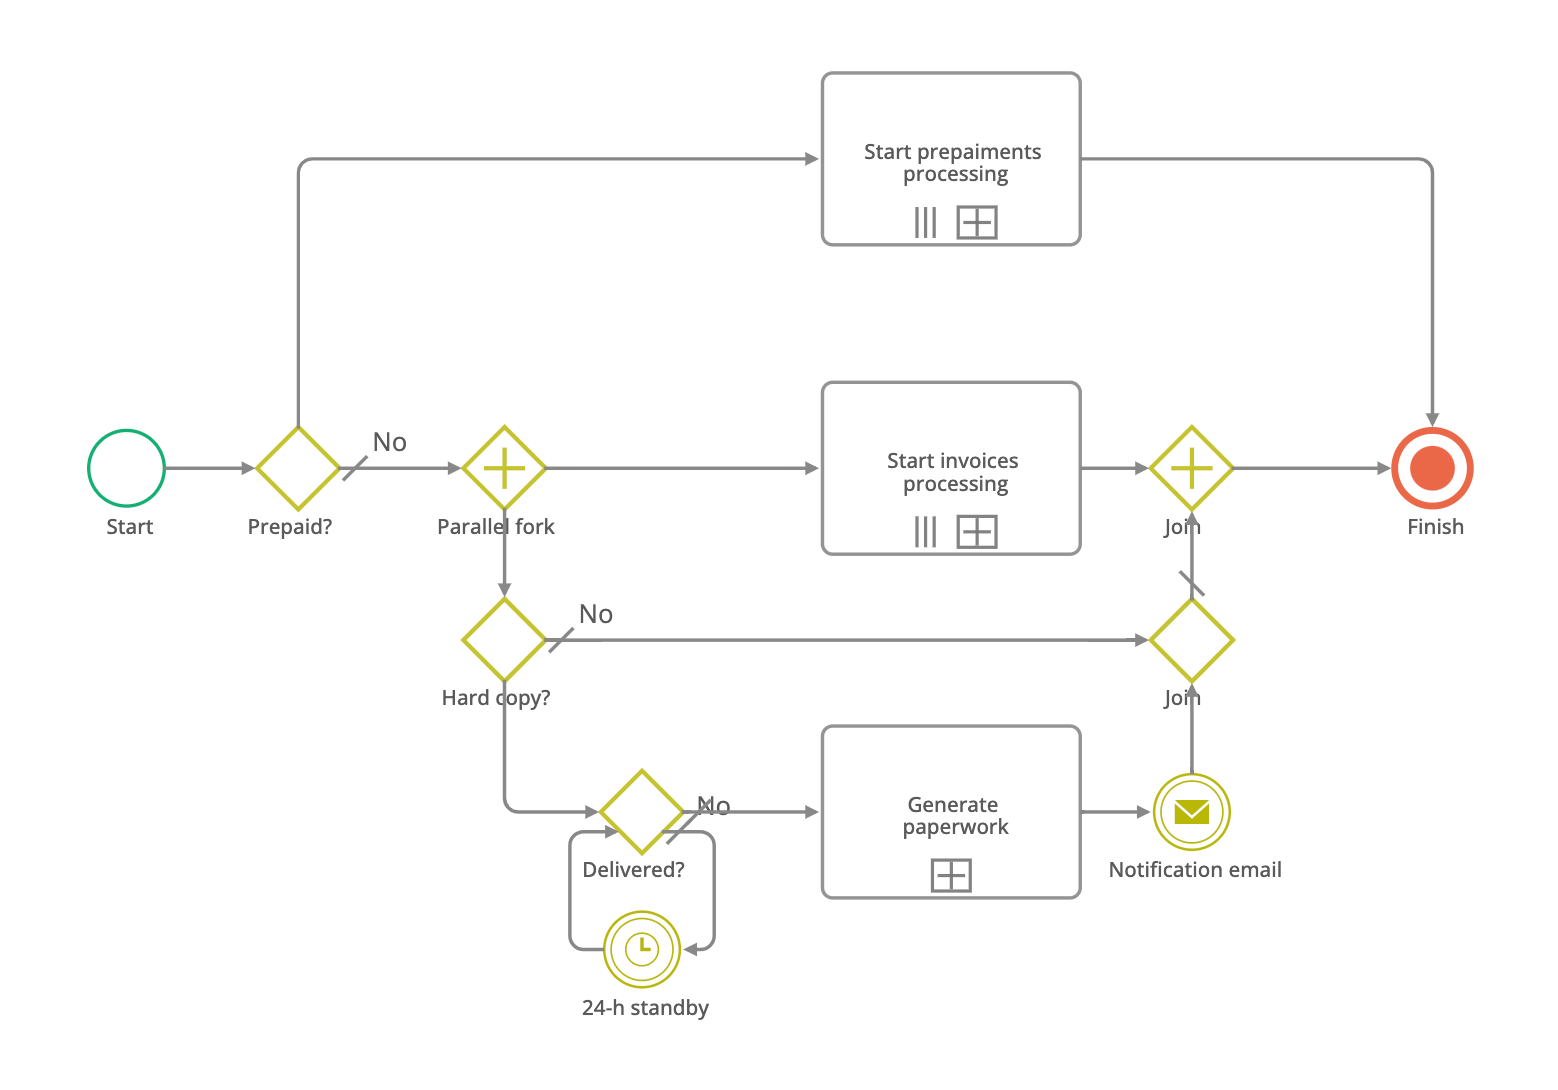
The example is useful because its branches raise concrete mapping questions. What determines whether prepayment applies? Which work proceeds in parallel? Who follows up when delivery remains unconfirmed? The wait is visible, but the diagram alone does not establish a service-level agreement (SLA), an escalation owner, or a maximum number of retries.
Gateway choice also matters. In BPMN, a parallel split starts all outgoing paths; a parallel join synchronizes its incoming paths. This behavior is defined in OMG BPMN 2.0.2, section 10.6.4. Before implementation, test that every required incoming path can reach the join. A diagram can look balanced while a particular branch combination leaves work waiting.
Our practical recommendation is to review the map alongside a responsibility list and an exception table. For the delivery wait, specify the role that investigates, the evidence that confirms delivery, and the action when confirmation never arrives. Those are questions to resolve for your implementation, not features or policy details inferred from the public image.
Turn the map into an improvement backlog
Give each finding a location in the map, supporting evidence, an owner, a proposed change, and an acceptance test. “Improve procurement” is too broad. “Requests returned by the buyer for missing delivery location” identifies a condition the team can investigate and address.
For the worked example, the backlog might contain three distinct changes: introduce required request fields, define which post-approval changes require reapproval, and make aged approvals visible to their responsible owner. Each can be tested independently. A policy clarification may solve a problem before software changes are necessary.
When automation is appropriate, extend the map into a specification: record states, data fields, role assignments, decision rules, reminders, integration behavior, and audit evidence. Specify what happens when an integration fails or the same request arrives twice. Use the workflow automation implementation checklist to evaluate that next stage.
Measure the process and check the quality of the map
A map explains the flow; measurements test whether changing it helped. Define the unit of work, timestamp source, reporting period, and exclusions before comparing results. Track open work as well as completed cases so a growing queue does not disappear from the report.
- Elapsed time: finish timestamp minus first-submission timestamp. Report a median and a tail measure such as the 90th percentile when the sample supports it; explain business-hours versus calendar-time treatment.
- Return rate: requests returned at least once for missing or incorrect information ÷ requests assessed in the same cohort × 100%. Count a request once even if it is returned several times; report repeat returns separately.
- Touch time: the sum of active handling time for a request. Do not treat the entire interval between two system events as active work unless that interpretation has been validated.
- Queue age: measurement time minus the time an open request entered its current queue. Segment by priority or request type when different service commitments apply.
Illustrative calculation: if 30 of 120 assessed requests were returned at least once, the return rate is 30 ÷ 120 × 100% = 25%. If a comparable pilot cohort has 12 returns among 120 assessed requests, its rate is 10%: a reduction of 15 percentage points. These are hypothetical numbers showing the calculation, not CMW Lab customer results or a forecast.
Use the following checklist as a practical review aid. It is an original editorial checklist, not a certification standard or a guarantee that a model is executable.
| Check | Evidence to look for | Action if missing |
|---|---|---|
| Clear scope | Named trigger, outcomes, exclusions, and process owner. | Complete the scope canvas before adding detail. |
| Traceable activities | Verb-and-object labels linked to a responsible role and case evidence. | Walk through a recent case with the people doing the work. |
| Defined decisions | Conditions and destinations for each relevant outcome. | Resolve ambiguous rules with the policy owner. |
| Complete handoffs | Required inputs, receiving role, and acceptance criteria. | Agree on what makes a task ready to accept. |
| Exception coverage | Returns, rejection, cancellation, overdue work, and failure recovery where applicable. | Add a route or a linked exception specification. |
| Measurable change | Baseline and pilot use matching definitions and explain differences in case mix. | Fix the measurement design before claiming improvement. |
| Maintained version | Owner, review date, change record, and access to supporting specifications. | Assign maintenance responsibility and review triggers. |
Common process mapping mistakes and how to avoid them
Drawing the official procedure instead of observed work. Keep discrepancies visible. A workaround may reveal missing system support or an impractical policy; erasing it from the map hides the issue.
Using one diagram for every audience. A sponsor needs boundaries and outcomes, while an implementer needs precise decisions and recovery behavior. Connect overview and detailed maps instead of compressing everything into unreadable boxes.
Showing only successful completion. Rejected, withdrawn, duplicate, and stalled requests consume capacity too. Define their endpoints and ownership rather than leaving an arrow labeled “Exception” with nowhere to go.
Automating an unexplained step. Ask what purpose an approval or data field serves before reproducing it in software. Removing a control also needs an explicit decision from its accountable owner.
Treating an AI-generated map as evidence. An AI tool can help organize workshop notes or draft a diagram, but a plausible sequence does not establish how your organization works. Check each activity and rule against records and participants, protect confidential inputs, and retain a traceable version. This is a recommended validation practice, not a claim about any specific product’s AI capabilities.
Frequently asked questions
What is business process mapping?
Business process mapping documents how work moves from a defined trigger to an outcome. A useful map shows activities, responsibility, decisions, and handoffs, with supporting information about inputs, outputs, and systems. It helps teams understand current practice and evaluate improvements, but its accuracy depends on validation against actual work.
How does process mapping work in practice?
Start by agreeing on the process boundaries, owner, and purpose, then trace real cases through the people and systems involved. Draw the current sequence, record exceptions, and validate the result with participants and records. Keep proposed improvements in a separate future-state version and test them before treating them as the new operating process.
What is the difference between process mapping and BPMN?
Process mapping is the practice of representing a process; BPMN is a standardized notation that can be used for that representation. A basic flowchart may be enough to explain a short sequence. BPMN is useful when precise event, decision, and coordination behavior matters, although execution still requires platform configuration and testing.
Which KPIs should a process map support?
Select key performance indicators that address the problem being investigated, such as elapsed time, return rate, touch time, or the age of open work. Define the start and finish events, denominator, reporting period, and exclusions. Use the same definitions when comparing the current process with a pilot, and explain differences in request mix.
What are the most common process mapping implementation mistakes?
Common mistakes include mapping the ideal procedure instead of current work, leaving handoffs undefined, ignoring exceptions, and treating a diagram as a complete automation specification. Avoid them by validating actual cases, assigning responsible roles, recording decision criteria, and testing failure and recovery paths alongside normal completion before implementing the revised workflow.
How we built this guide: definitions and notation were checked against ASQ, the Lean Enterprise Institute, and OMG. The CMW Lab diagram is public first-party material. The scope canvas, checklist, purchase-request maps, and calculations are original editorial examples, not reported customer outcomes.
Use the map to make the next decision
A useful workflow map gives a team a shared, testable account of its work. Start with a bounded process, show the difficult cases, and connect each proposed change to evidence and an acceptance test. If your next step is to move from a validated model to an implemented workflow, explore CMW Lab’s BPMN modeling capabilities with your scope canvas and exception list in hand.